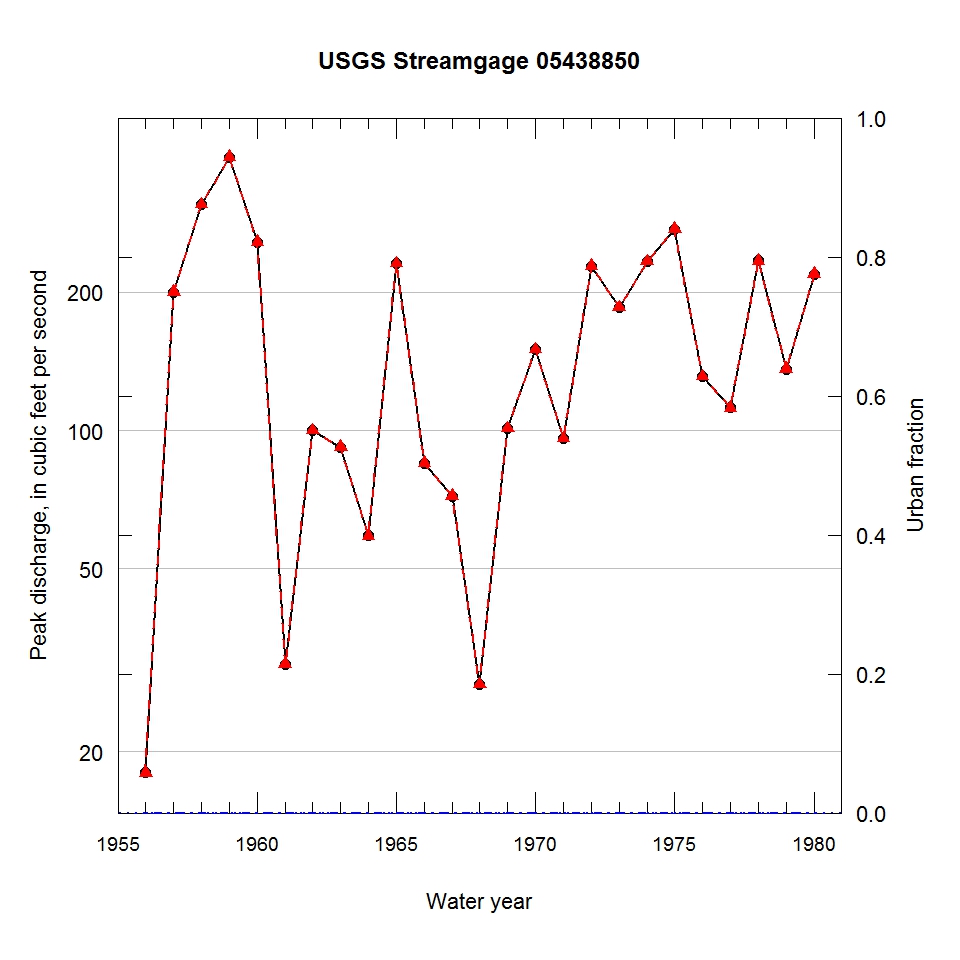
Observed and urbanization-adjusted annual maximum peak discharge and associated urban fraction and precipitation values at USGS streamgage:
05438850 MIDDLE BR OF S B KISHWAUKEE RIVER NEAR MALTA, IL


| Water year | Segment | Discharge code | Cumulative reservoir storage (acre-feet) | Urban fraction | Precipitation (inches) | Observed peak discharge (ft3/s) | Adjusted peak discharge (ft3/s) | Exceedance probability |
| 1956 | 1 | -- | 0 | 0.000 | 0.929 | 18 | 18 | 1.000 |
| 1957 | 1 | -- | 0 | 0.000 | 0.241 | 200 | 200 | 0.295 |
| 1958 | 1 | -- | 0 | 0.000 | 0.963 | 310 | 310 | 0.091 |
| 1959 | 1 | -- | 0 | 0.000 | 1.379 | 393 | 393 | 0.047 |
| 1960 | 1 | -- | 0 | 0.000 | 1.227 | 257 | 257 | 0.162 |
| 1961 | 1 | -- | 0 | 0.000 | 0.761 | 31 | 31 | 0.967 |
| 1962 | 1 | -- | 0 | 0.000 | 0.796 | 100 | 100 | 0.732 |
| 1963 | 1 | -- | 0 | 0.000 | 0.422 | 92 | 92 | 0.768 |
| 1964 | 1 | -- | 0 | 0.000 | 0.861 | 59 | 59 | 0.899 |
| 1965 | 1 | -- | 0 | 0.000 | 0.850 | 231 | 231 | 0.208 |
| 1966 | 1 | -- | 0 | 0.000 | 0.537 | 85 | 85 | 0.798 |
| 1967 | 1 | -- | 0 | 0.000 | 0.011 | 72 | 72 | 0.851 |
| 1968 | 1 | 4B | 0 | 0.000 | 0.002 | 28 | 28 | 0.973 |
| 1969 | 1 | -- | 0 | 0.000 | 1.393 | 101 | 101 | 0.727 |
| 1970 | 1 | -- | 0 | 0.000 | 1.589 | 150 | 150 | 0.482 |
| 1971 | 1 | -- | 0 | 0.000 | 0.236 | 96 | 96 | 0.752 |
| 1972 | 1 | -- | 0 | 0.000 | 1.323 | 228 | 228 | 0.216 |
| 1973 | 1 | -- | 0 | 0.000 | 0.408 | 185 | 185 | 0.343 |
| 1974 | 1 | -- | 0 | 0.000 | 1.499 | 233 | 233 | 0.203 |
| 1975 | 1 | -- | 0 | 0.000 | 0.893 | 274 | 274 | 0.136 |
| 1976 | 1 | -- | 0 | 0.000 | 0.002 | 131 | 131 | 0.583 |
| 1977 | 1 | -- | 0 | 0.000 | 0.757 | 112 | 112 | 0.673 |
| 1978 | 1 | -- | 0 | 0.000 | 1.112 | 234 | 234 | 0.200 |
| 1979 | 1 | -- | 0 | 0.000 | 1.608 | 136 | 136 | 0.555 |
| 1980 | 1 | -- | 0 | 0.000 | 0.731 | 219 | 219 | 0.240 |

